
OPENING QUESTIONS:
How did we calculate distance to eq epicenters?
How did we use that information to plot the actual epicenter location?
Please discuss!
I've asked Ms Ley to lead the conversation on this-- please impress her with you know how!
Please make sure to tend to these if you haven't already!
Period 03 - Please submit your EQ Preparedness plan using our class submission plan HERE (make sure you share your work with me!)
Period 04 - Please submit your EQ Preparedness plan using our class submission plan HERE (make sure you share your work with me!)
OBJECTIVE: I will work with my team to develop a HOME centered infrastructure Mind Map during today's class.
WORDS FOR TODAY:
- primary (p) waves - Travel through all types of material and arrive first.
- secondary (s) waves - Only travel through solid rock (not liquids of any sort) and arrive later
- surface waves - Only travel along the surface of the earth-- they arrive LAST but are most destructive
- focus - The location of an earthquake inside the Earth
- epicenter - The point on the Earth's Surface directly above an earthquake
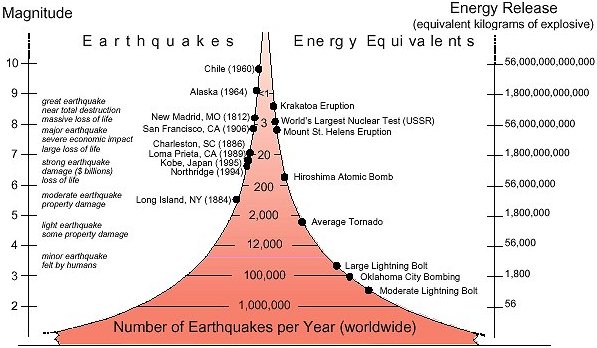
- magnitude - a measure of the amount of energy released during the entire time an earthquake occurred. Measurements are shown using a logarithmic scale where each successive integer represents an increase of 10 x more energy.
- moment magnitude- ( Mw) a specific type of magnitude measurement that takes into account the physical features of the ground/crust where the eq occurred
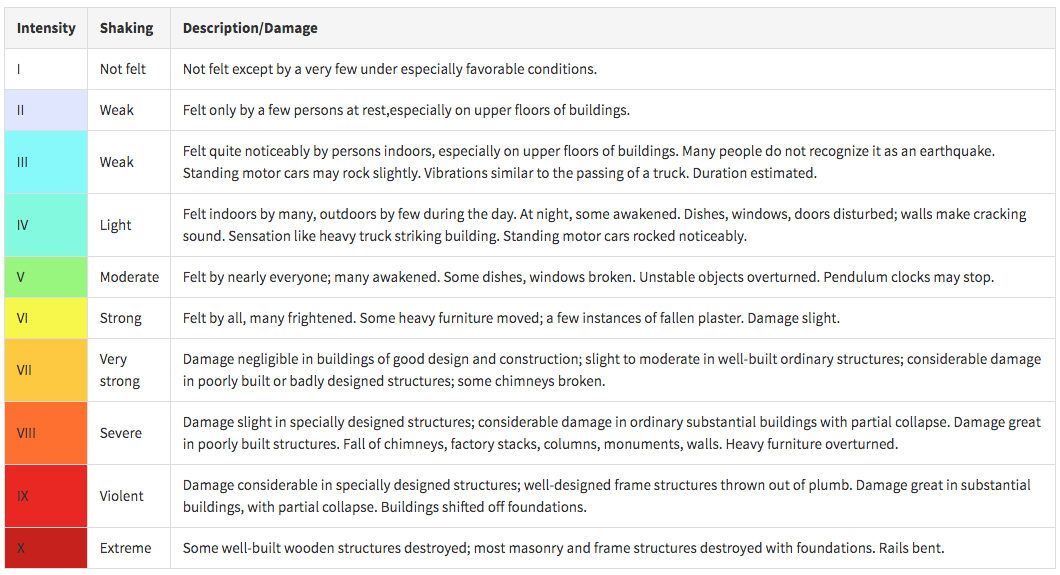
- intensity - a measure of the observed impact of an earthquake on a specific community.
- The Modified Mercalli Intensity Scale (MMI). A numeric scale, usually listed using Roman Numerals (to avoid confusion with magnitude) that describes the expected observed damage done to a community
- liquefaction - the tendency for ground/soil to behave like a liquid during an earthquake -- particularly important in areas built on mud, sand and areas that have been 'reclaimed' by humans.
CALENDAR:
- Waves retake will be Friday, May 31st after school. Please arrive by 2:05
- EQ Unit test will be next Monday
FORMULAE OBJECTUS:
Magnitude - Note the logarithmic scale:
Intensity - Note the Roman Numeral scale and the observational (as opposed to measured) nature of the descriptions
WORK O' THE DAY:
In case you missed the calendar (above) entries. Here they are again:
- Waves retake will be Friday, May 31st after school. Please arrive by 2:05
- EQ Unit test will be next Monday
Please continue with this project in ALL detail. Keep in mind this will basically be your review for the EQ Waves test on Monday!
Working to incorporate our Words O' The Day into your poster is key in that regard. It can be kind of a throwaway "doing" sort of task -- Which ain't so helpful.
However, if you work *thoughtfully* that activity should prepare you for your test nicely!
Please have the GREEN person be PM for this project (if there ain't no Green default to Blue). Please make sure everyone is engaged, involved and talking (about the project!)
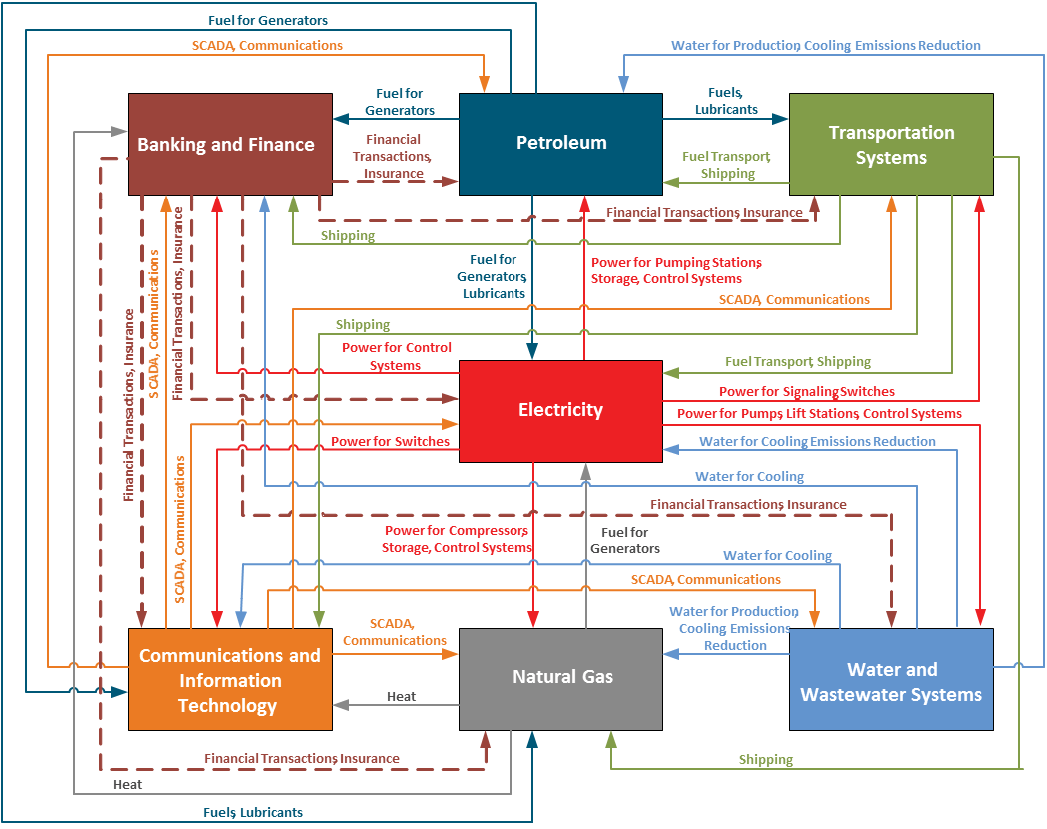
Review the following infrastructure graphic (These sorts of graphics are sometimes called mind maps)
Notice that:
- Each main infrastructure type is placed in the center of the map and given a specific color.
Work with your team to analyze the various features of this graph:
- the direction of the line/arrow between various infrastructure types
- the description shown along the connecting line
- the type of infrastructure
═══════════════════════════
- Now please grab our usual 4 feet (or so) of butcher paper (remember there are two rolls in the classroom)
-
Draw a vertical line about 1 foot from the left side (we'll get back to that later)
-
Reproduce the infrastructure map shown above using approximately the same colors (grab color pencils from the back counter, I got lots!) but ONLY show the infrastructure types. You'll create your own lines/arrows/relationships/descriptions in a moment. HOWEVER:
-
please replace the Petroleum item with "Electricity"
-
please replace electricity with "MY HOME" (in Fuscia!)
-
-
Use meter sticks to drawn your own relationships between your HOME (conveniently located at the center of your map) and the other infrastructure types.
-
Remember to use the same color as the originating infrastructure to draw your lines
-
Remember to add arrowheads to show the direction of the action
- Make sure your description is clear & concise & accurate
-
You can draw inspiration from the map but simply copying or rephrasing the existing chart is not helpful.
-
-
Finally-- in the 1 foot section on the left side of your poster, please use EACH of our Words of the Day in context (in a full sentence) to describe anything referred to or implied on your chart in the case of a 7.0 magnitude EQ on the Tacoma Fault and its impact on Gig Harbor.
At the end of class, please place all posters flat on top of each other on a table in the back
I should be back on Thursday, see you then!